From habit to digit
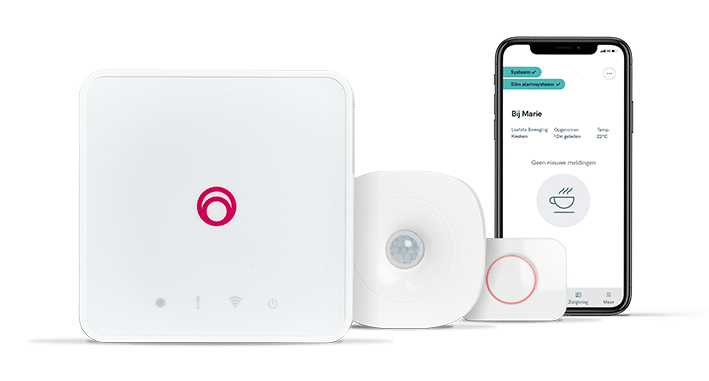
The Jane solution includes a kit of six motion sensors, each to be mounted in a room of the elder’s home. The data from these sensors allows the one taking care of the elder to set custom alerts from the Jane App, e.g. ‘If mother doesn’t enter the kitchen between 9 AM and 11 AM, send me a notification’. The caretaker can add as many custom alerts as they consider necessary, however, setting relevant alerts for every possible scenario would be impractical. This is where smart alerts come in. Humans are creatures of habit, and when we quantify these habits, we can apply anomaly detection techniques to detect emergencies.
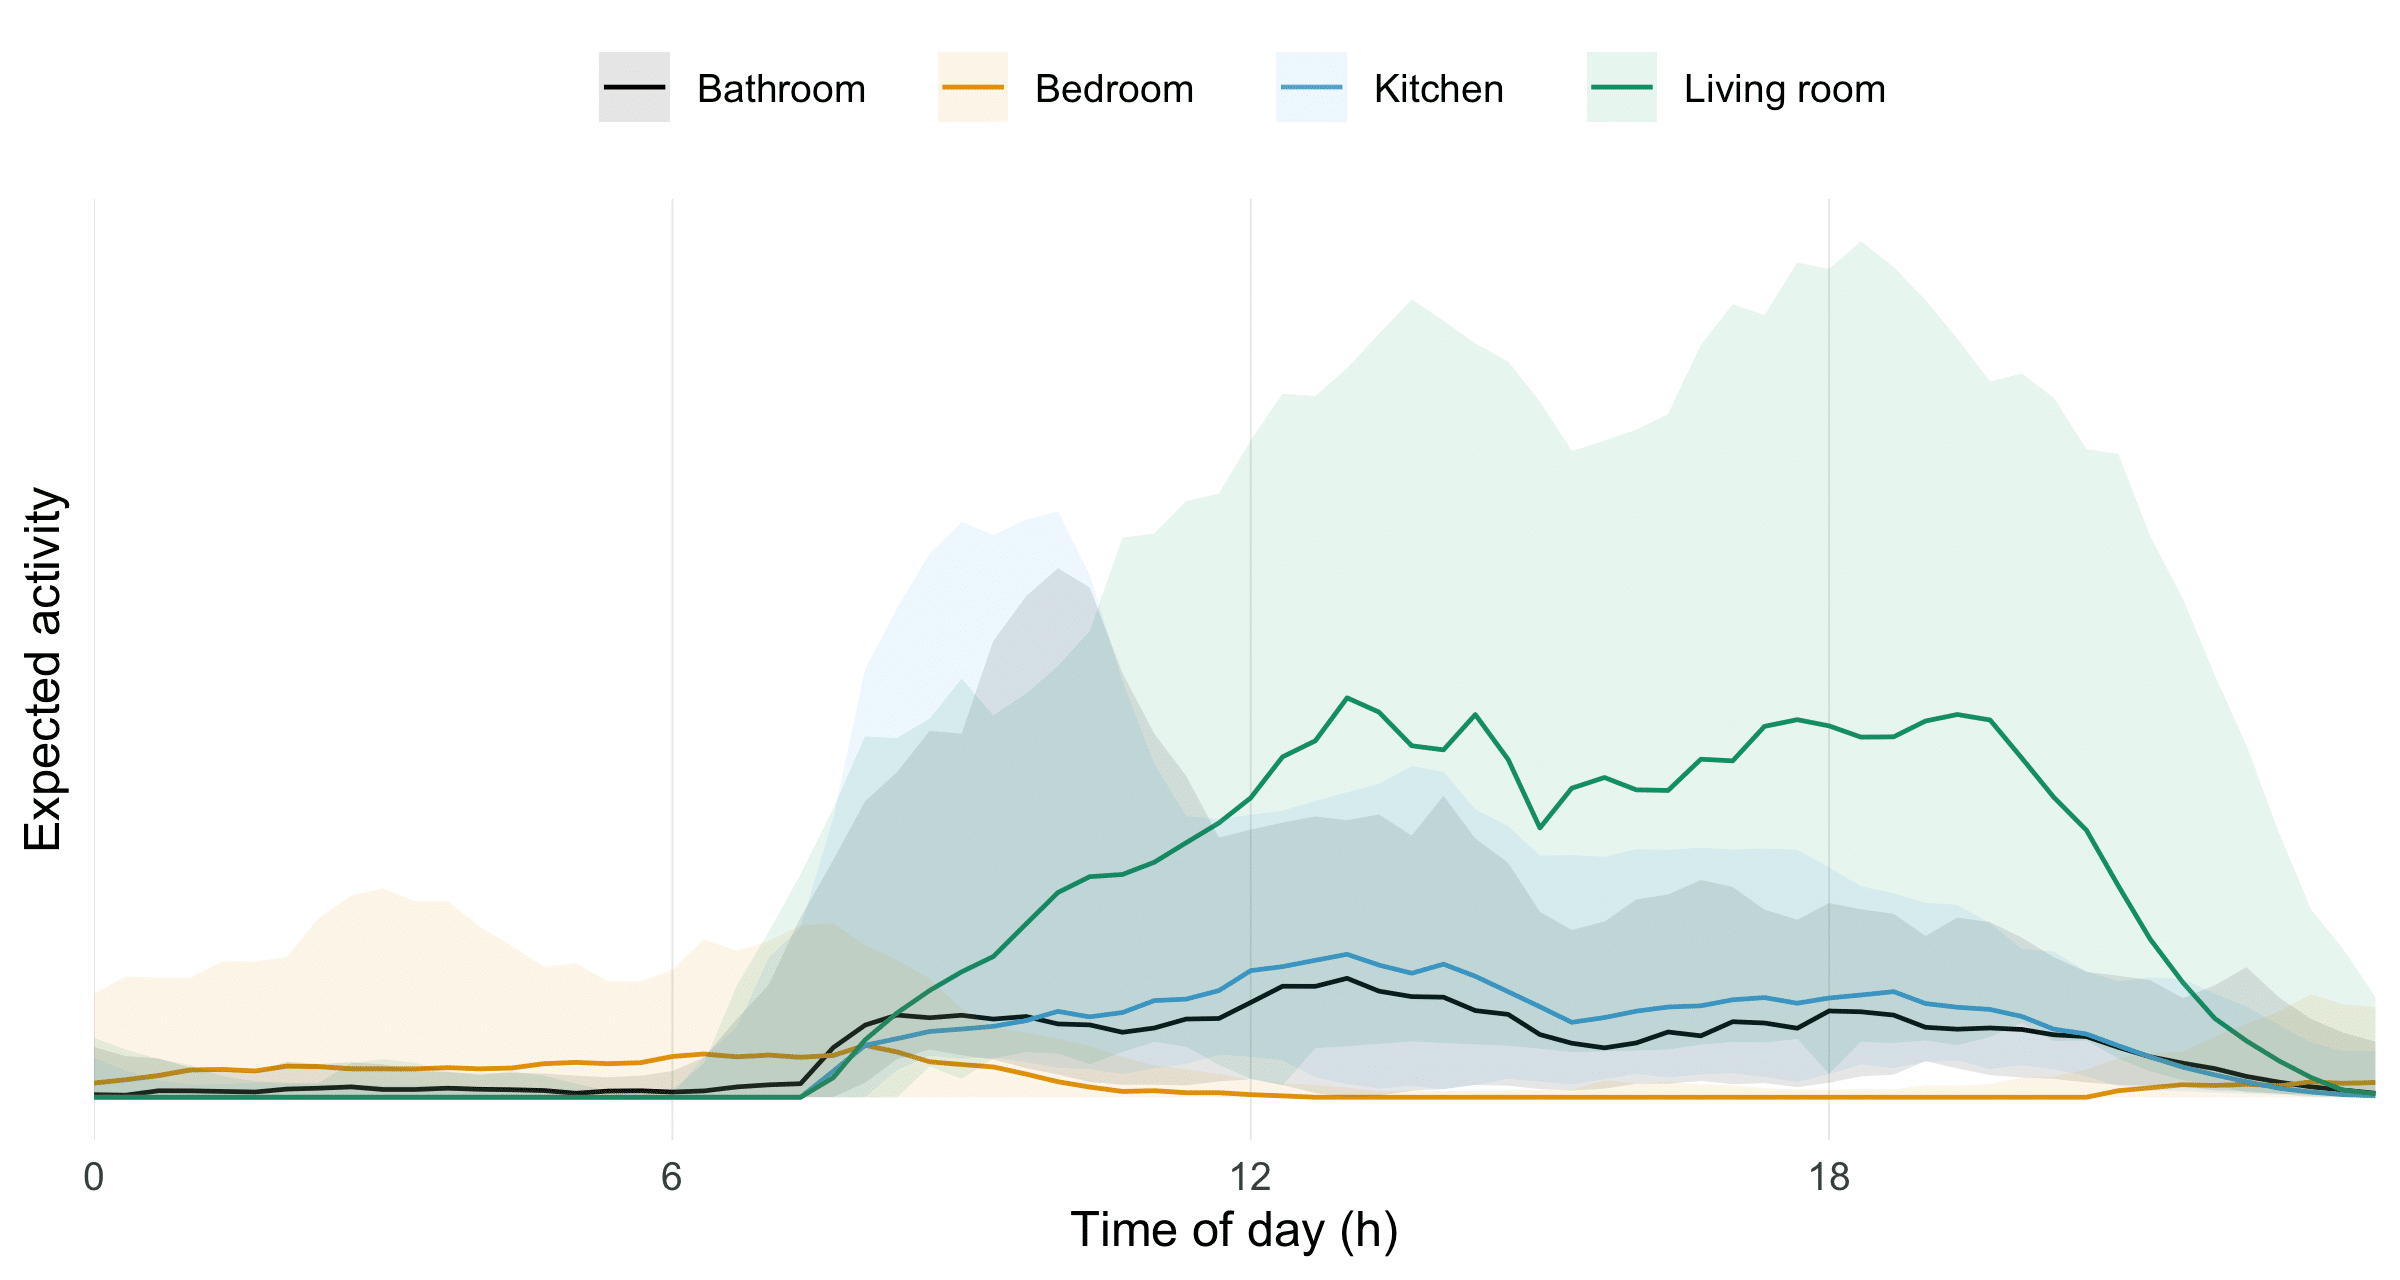
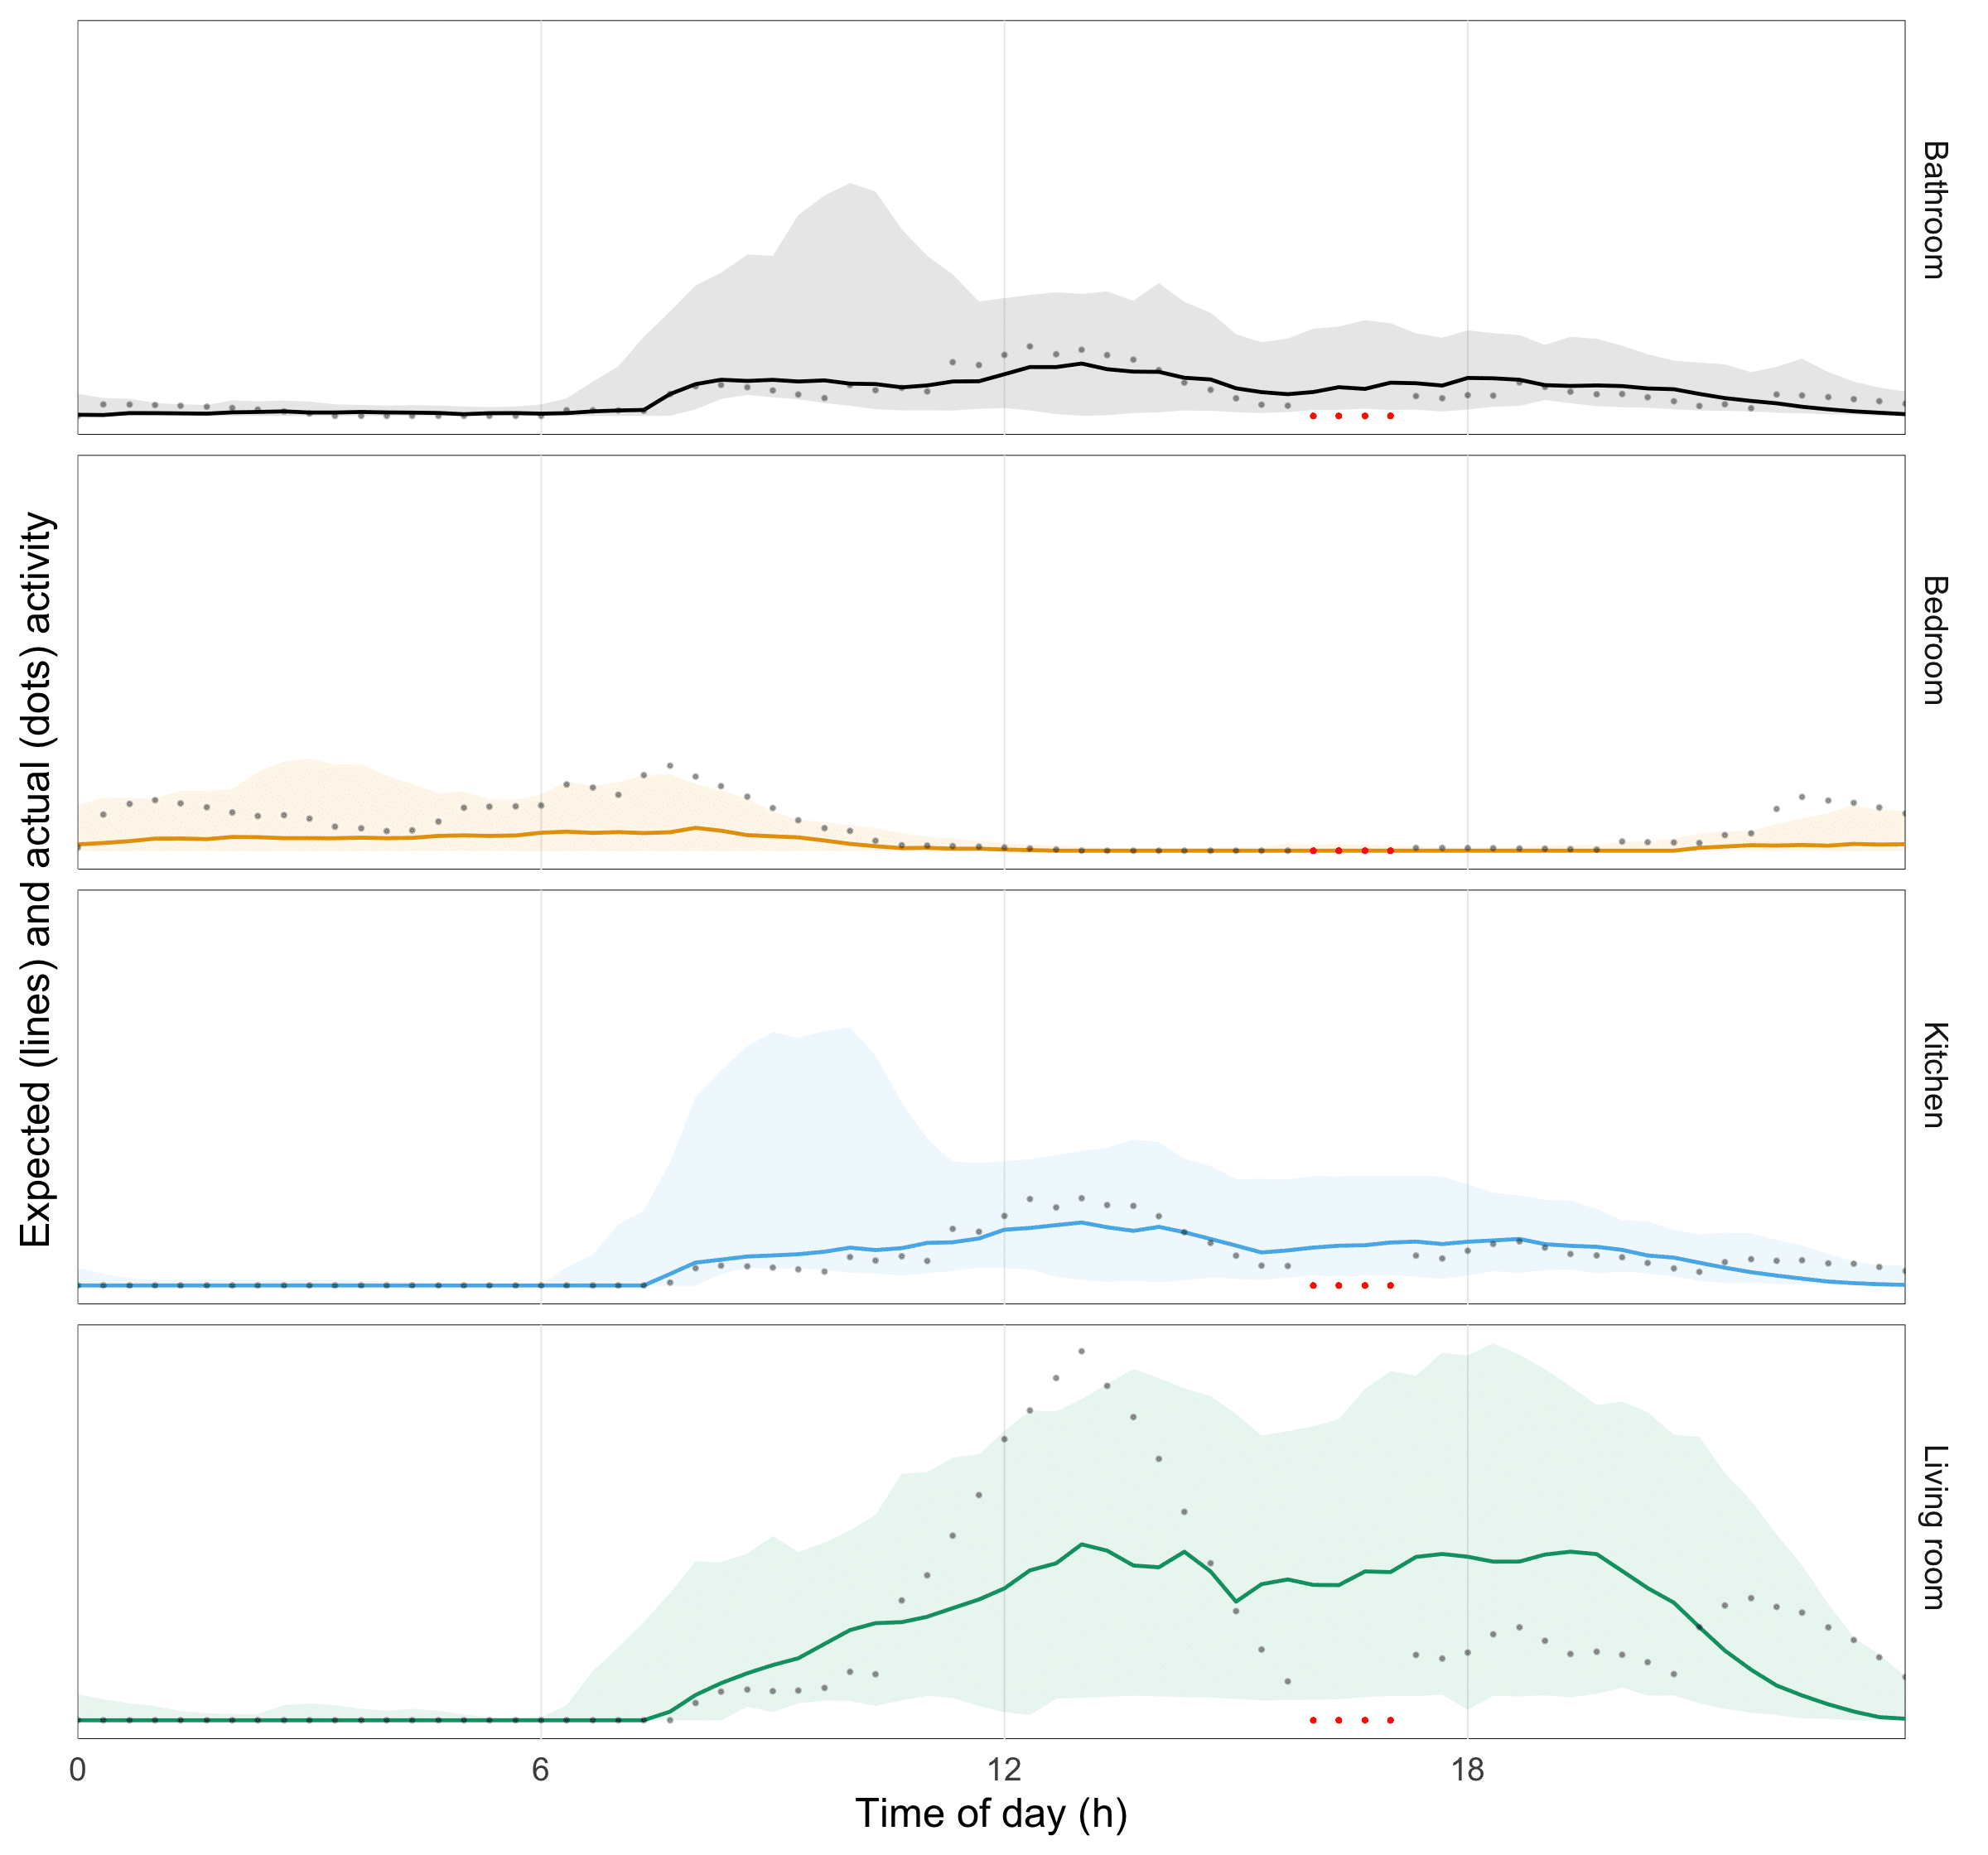
By aggregating the per-room daily routines into minimal and maximal levels of expected activity on historical data, we can constantly check whether the current activity levels are within the expected range (see color bands in Figure 1). Once too many rooms are off, an alert is sent (see red dots in Figure 2).
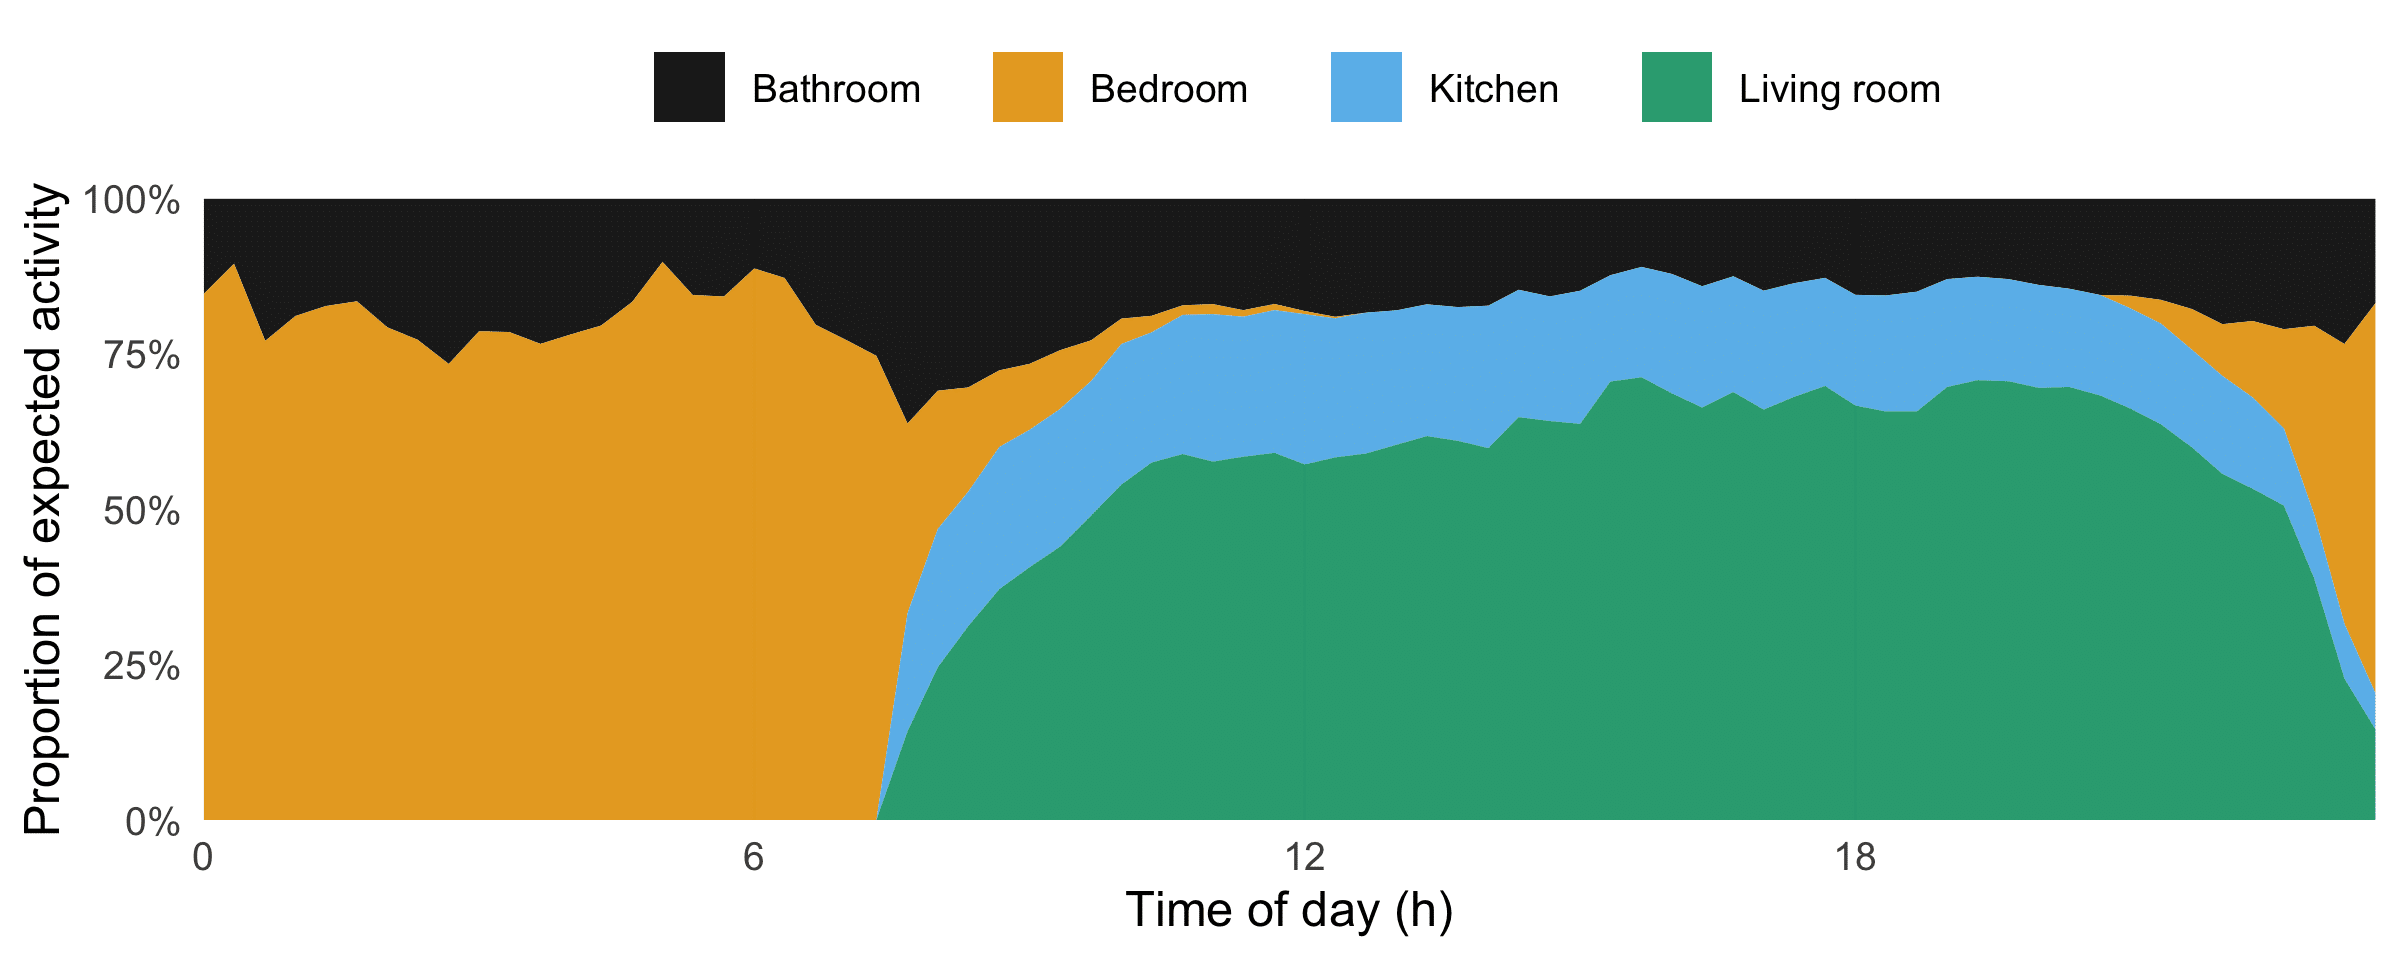
Simply counting the rooms with anomalous activity to decide if a situation is alarming turned out to be very sensitive to what was happening in rooms where hardly any activity was expected during that part of the day. To cope with this, we added weights to each room that vary during the day depending on where most activity is expected to take place (see Figure 3). The decision on whether a situation is alarming then comes down to check whether the total weight of all the rooms with anomalous activity is above a certain threshold. E.g. when most activity is expected in the living room at 3 PM, the lack of activity in that room will have a big influence on the decision to send an alert or not.
Dealing with per-weekday activity differences
While aggregating the expected activity pattern we first made the naïve assumption that every day of the week would be generally the same. However, from our exploratory data analysis, we knew that this assumption was not always valid.
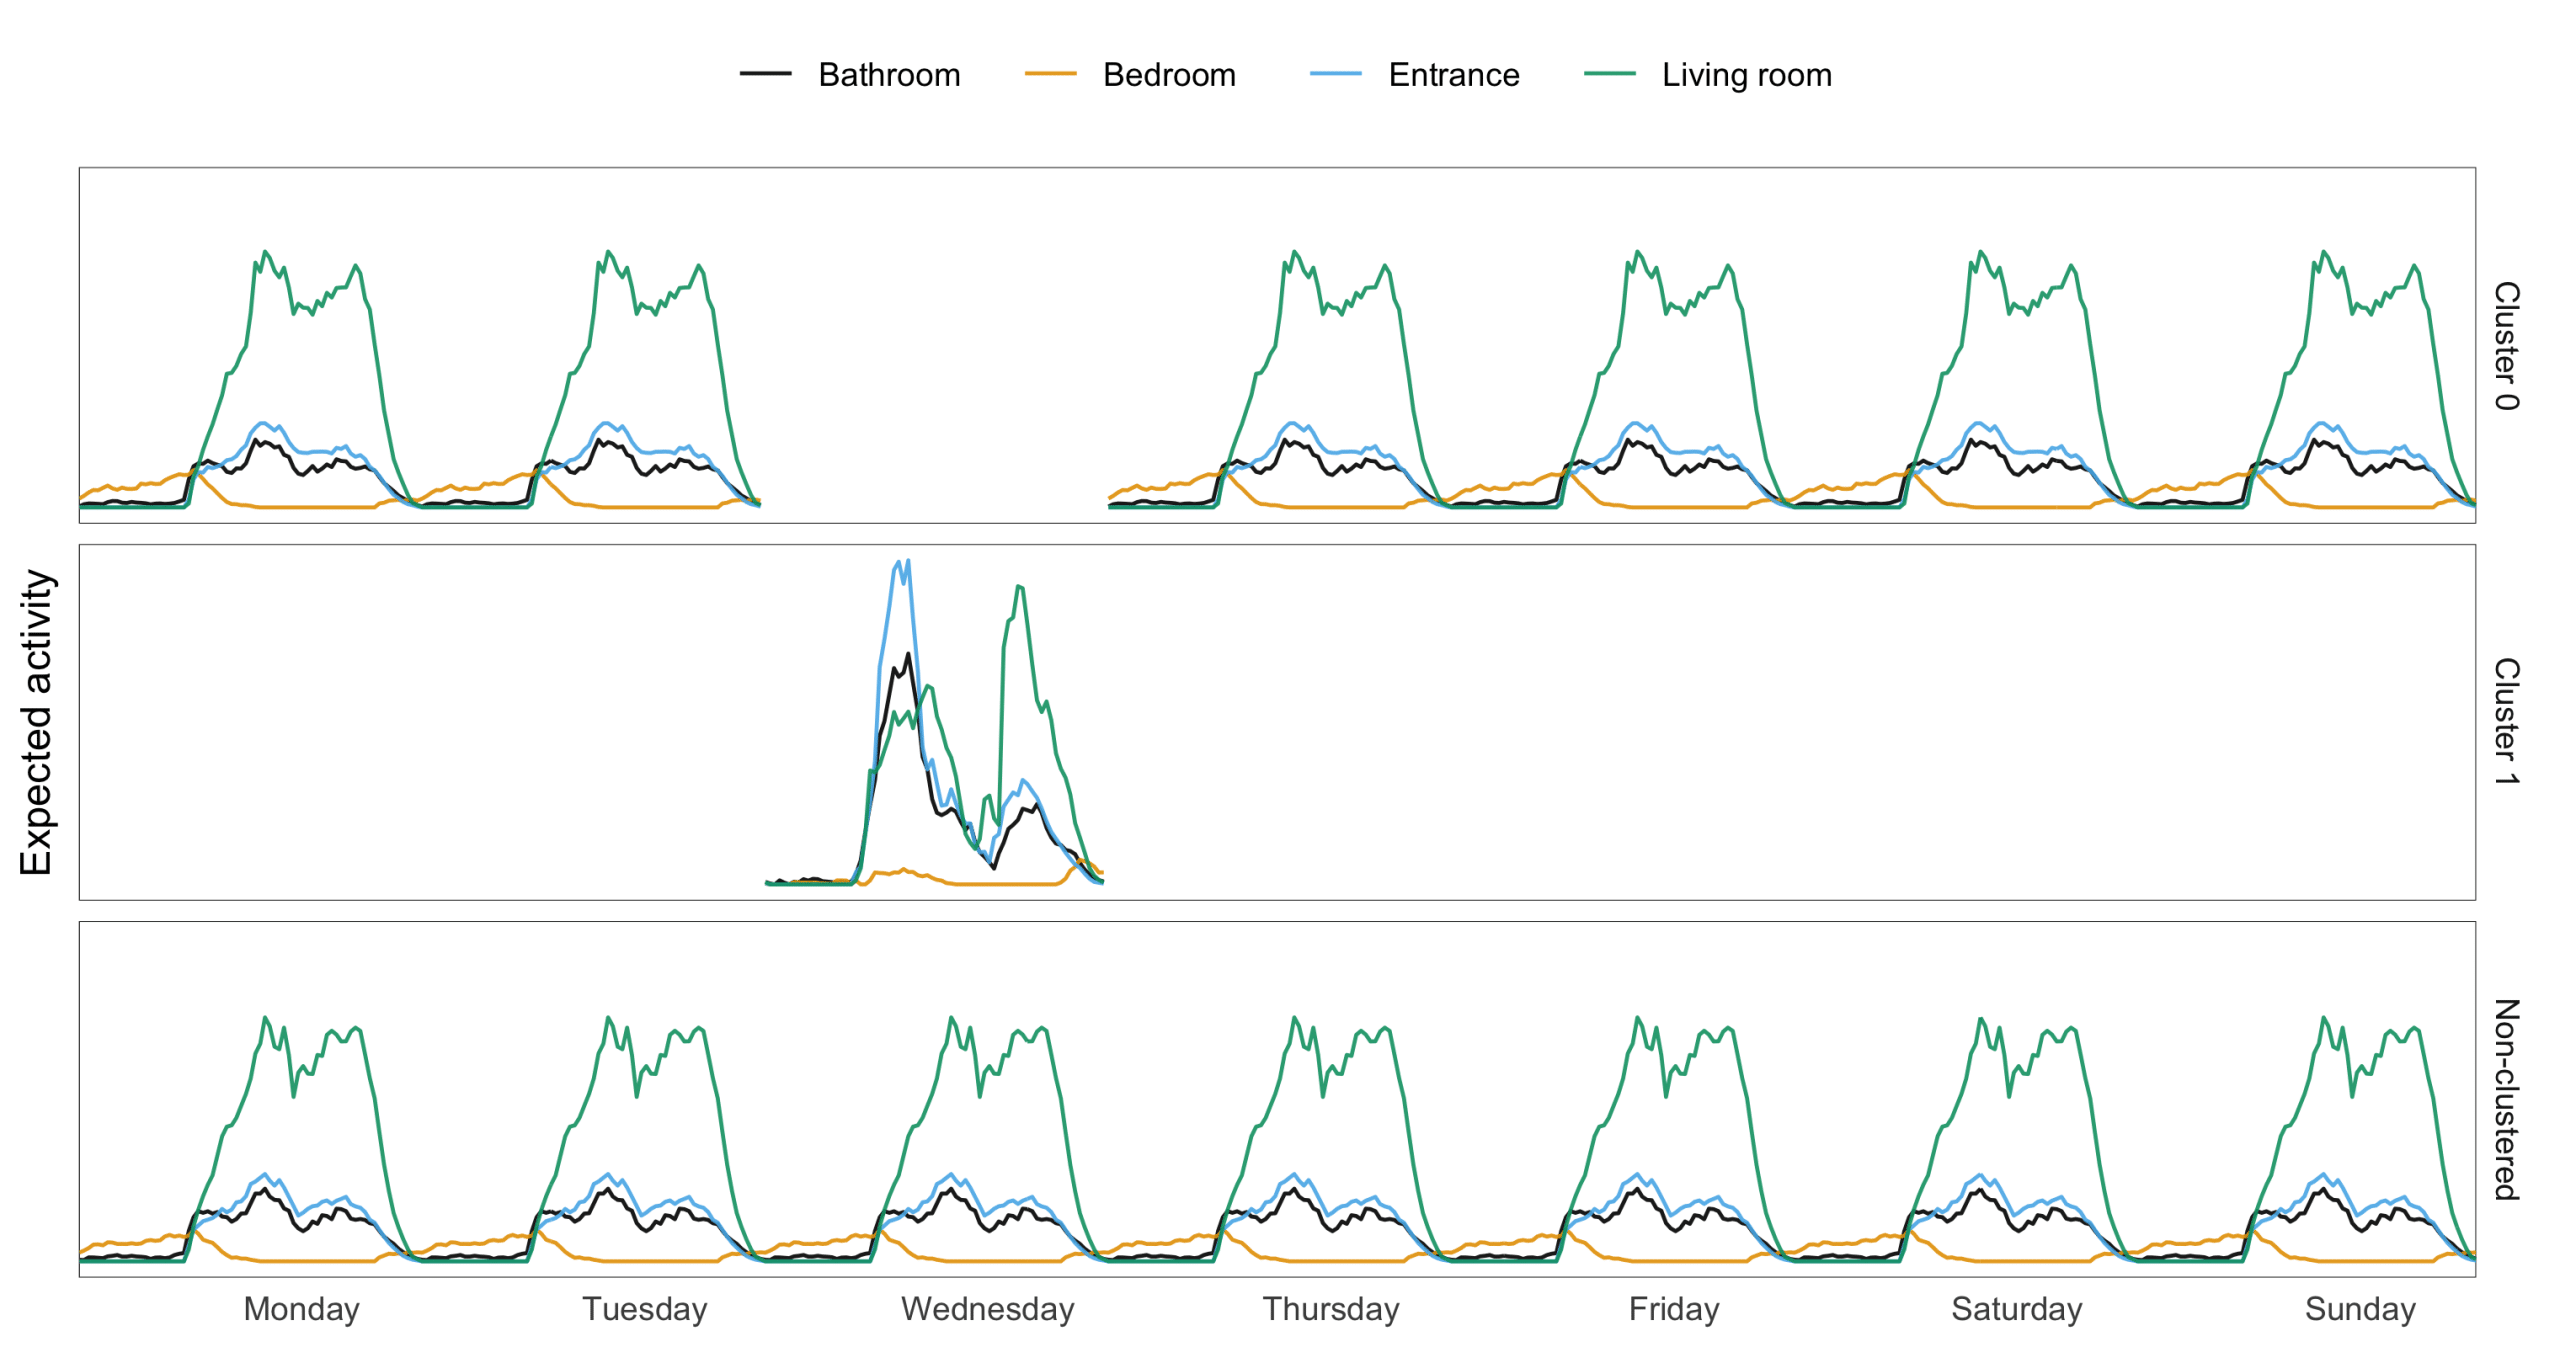
What if someone visits to clean the house every Wednesday morning? These visits will have a significant impact on the registered activity pattern and will pollute the expected patterns of ‘normal’ days. To deal with this, we first calculate the expected activity pattern for each weekday individually (as in Figure 4) and then cluster weekdays that have similar patterns. For each cluster, we then recalculate the expected pattern (see Figure 5).
Simulating emergencies
One scenario that we hope to avoid at all costs is that of a full-motion stop (such as in Figure 2). The Jane sensor kit includes a panic button that the elders can press to trigger a direct alert. Should they be unable to do so, we fall back on the smart alerts to detect the anomaly. Through simulations where the historical data is altered to include such full-motion stops, we’re able to estimate the time till the first alert. This turned out to be within 2 hours typically.
Multiple angles
In addition to the expected vs actual activity analysis discussed above, the system also derives wake-up and go-to-bed times, detects elders not returning to bed after a bathroom visit at night, and more. This multi-angled approach allows caretakers to spot issues early on.
Conclusion
The Jane smart alert system has matured through several iterations with testers providing invaluable feedback that allowed the system to reach the accuracy it has today. The result is that caretakers can follow up on their loved ones without being around all the time. Offering them peace of mind and allowing the elders to stay at home longer.


